The problem
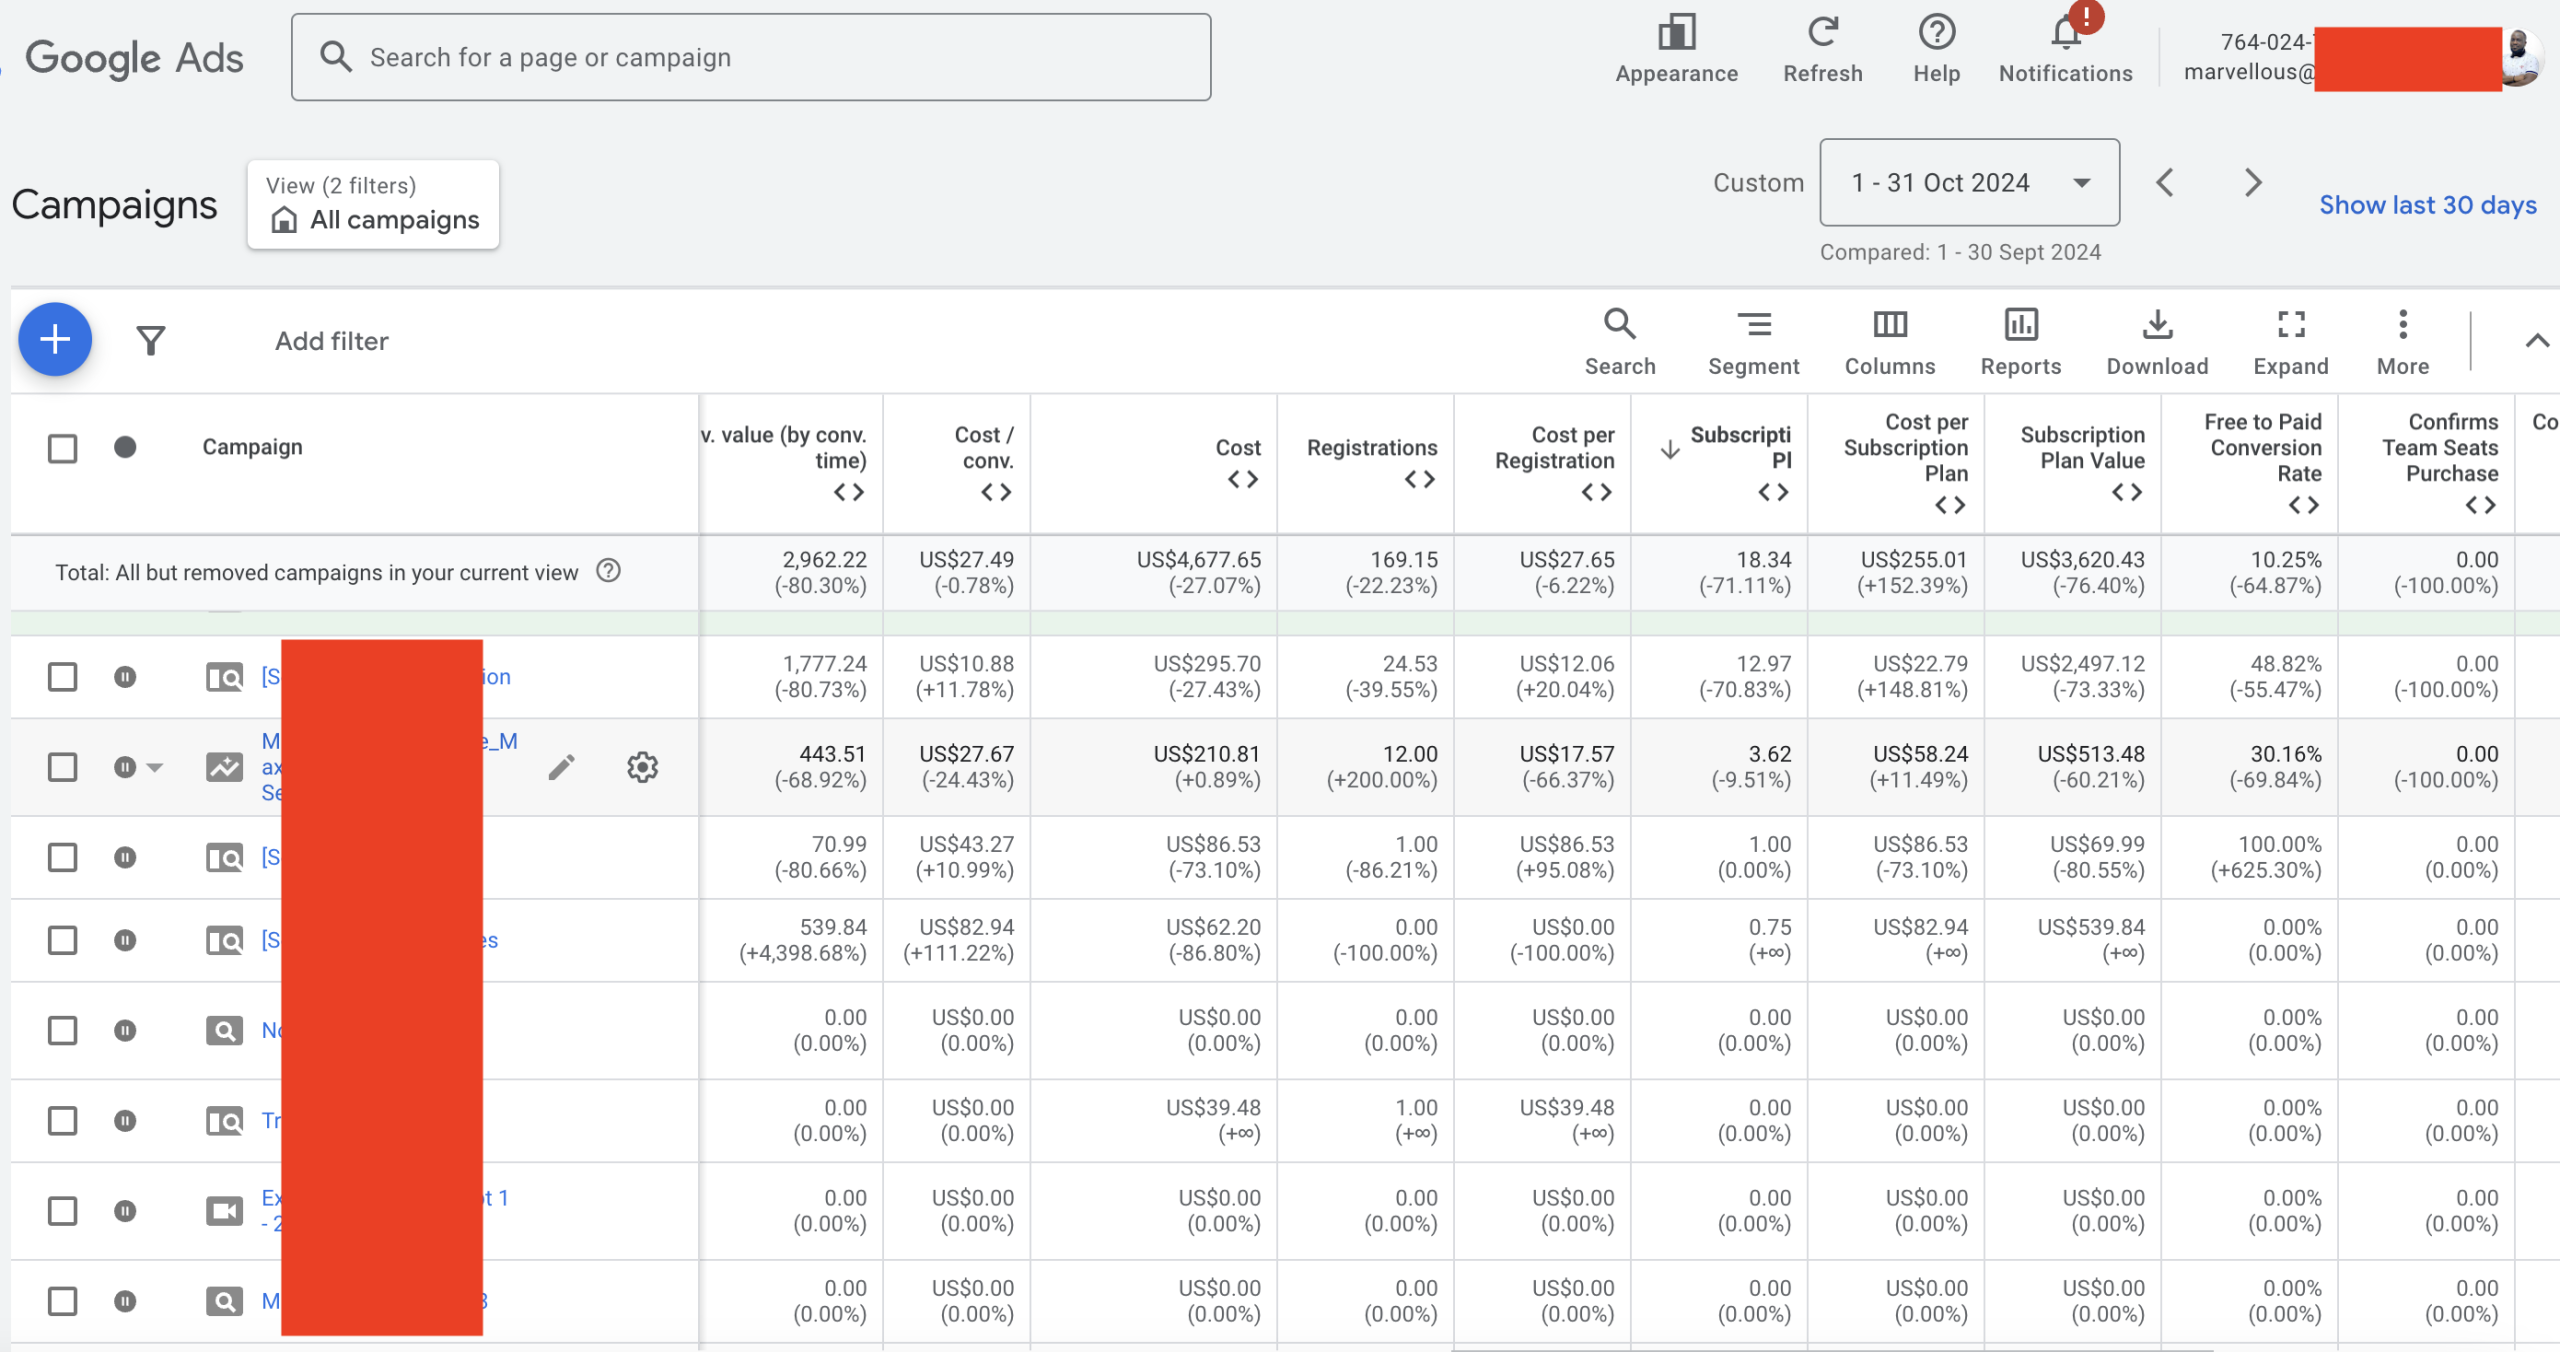
A US-based SaaS platform helping therapists automate notes and streamline insurance billing. Despite strong traffic and free-trial signup volumes, the brand was burning ad spend without turning enough users into paying customers. Their cost per subscription was over $250, making the funnel unsustainable.
- High cost per subscription plan: $255
- No clear tracking for which campaigns were driving actual revenue
- Fragmented campaigns leading to inefficient budget distribution
What we did
Deep account audit
- Identified budget waste in campaigns that weren't driving revenue
- Flagged poor-performing segments and paused them
Conversion tracking overhaul
- Fixed Google Ads and GA4 tracking
- Ensured accurate tracking for registrations, subscriptions and free-to-paid conversion rate
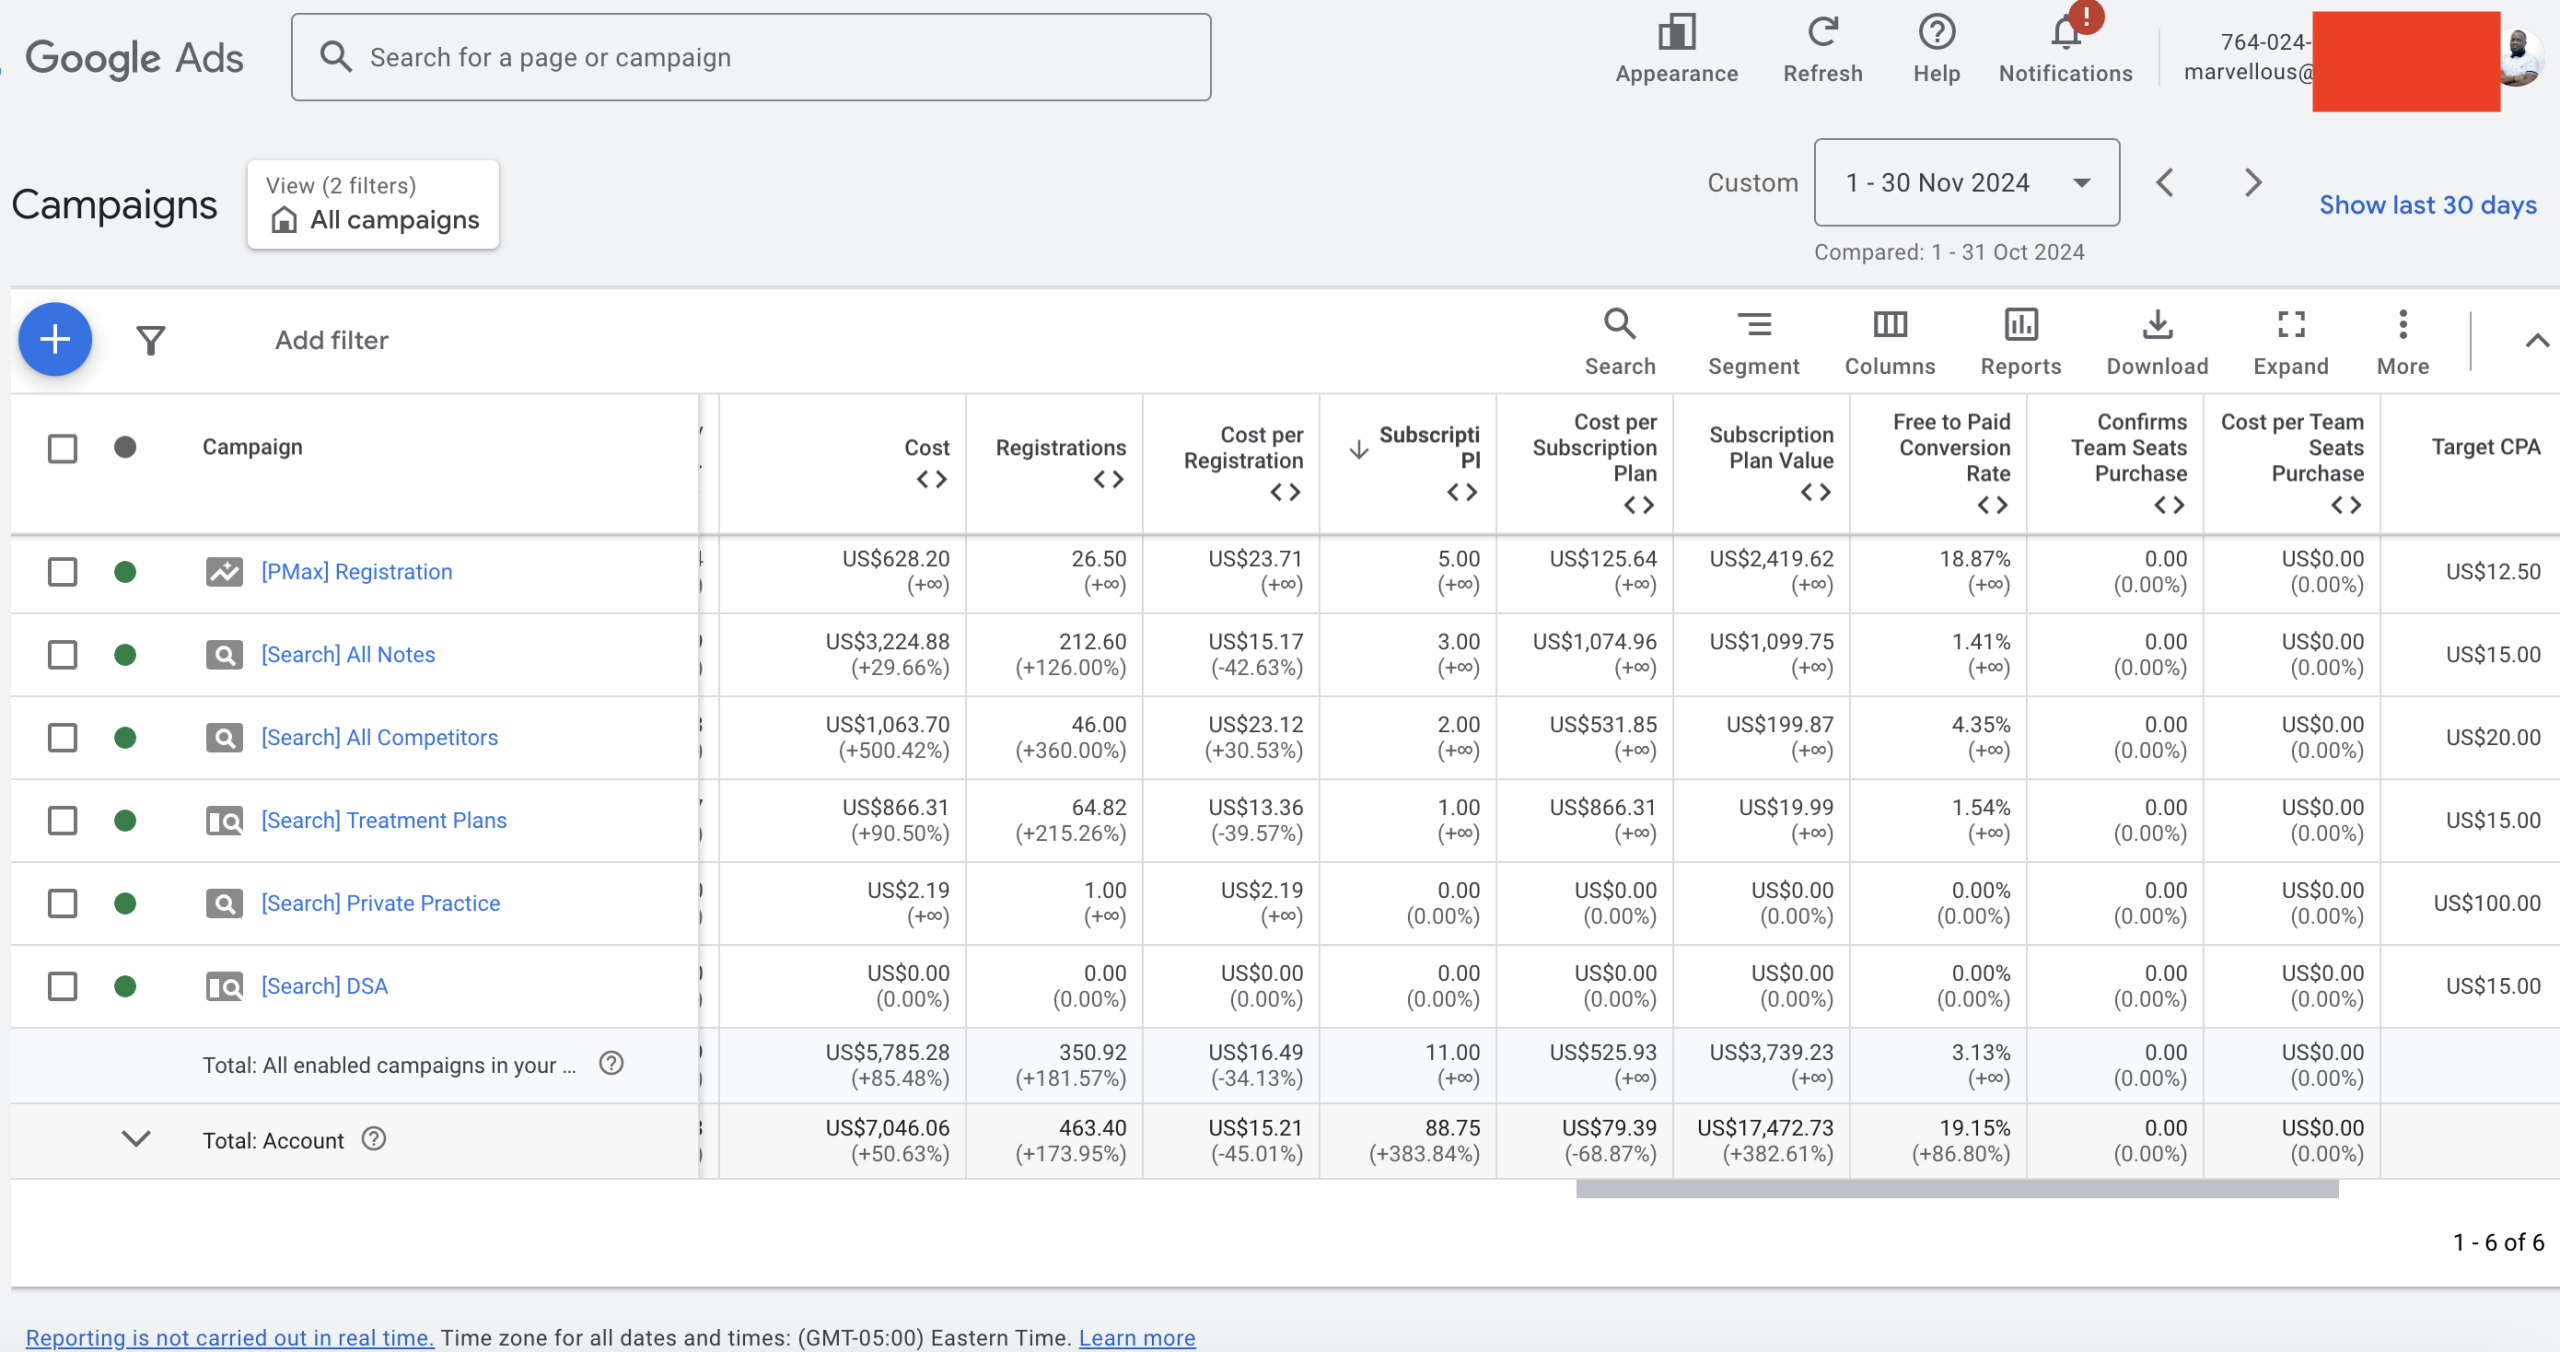
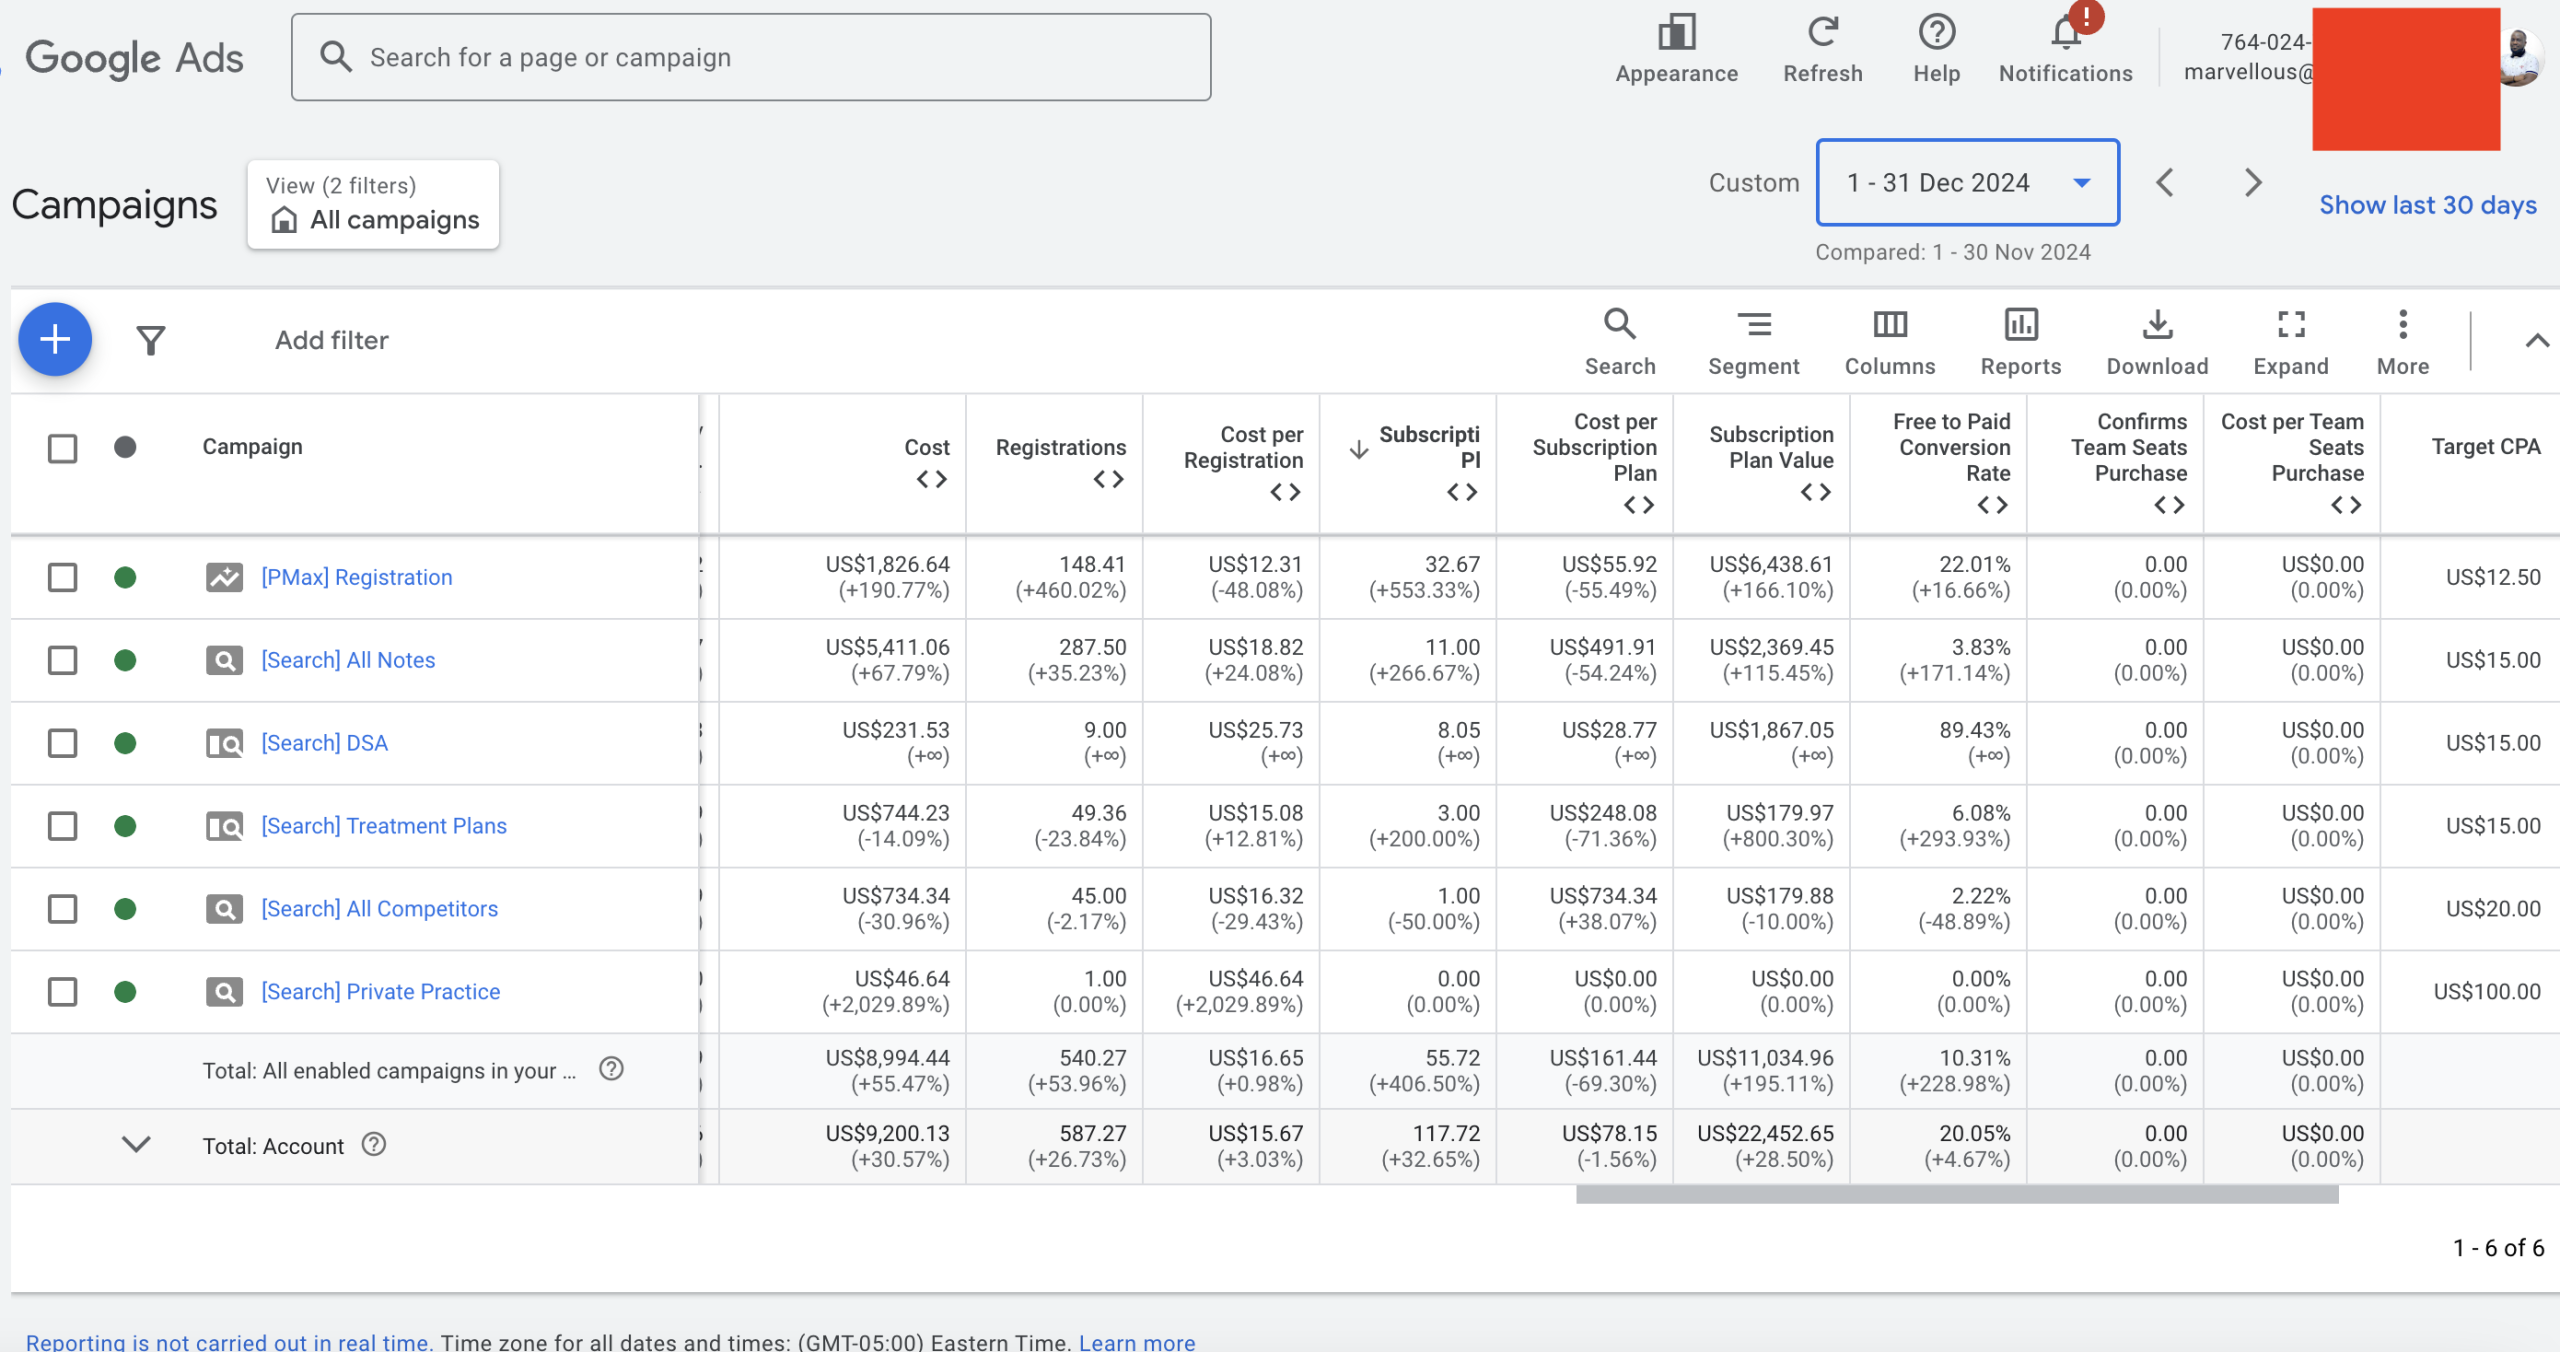
Smart campaign consolidation
- Reduced campaign bloat and grouped efforts by intent
- Split into top-of-funnel (registrations) and bottom-of-funnel (subscriptions)
Remarketing campaign launch
- Built remarketing segments targeting recent signups
- Used Search and PMax ads to push them toward paid plans
The outcome
| Metric | Before (Oct 2024) | 90 Days After | Change |
|---|---|---|---|
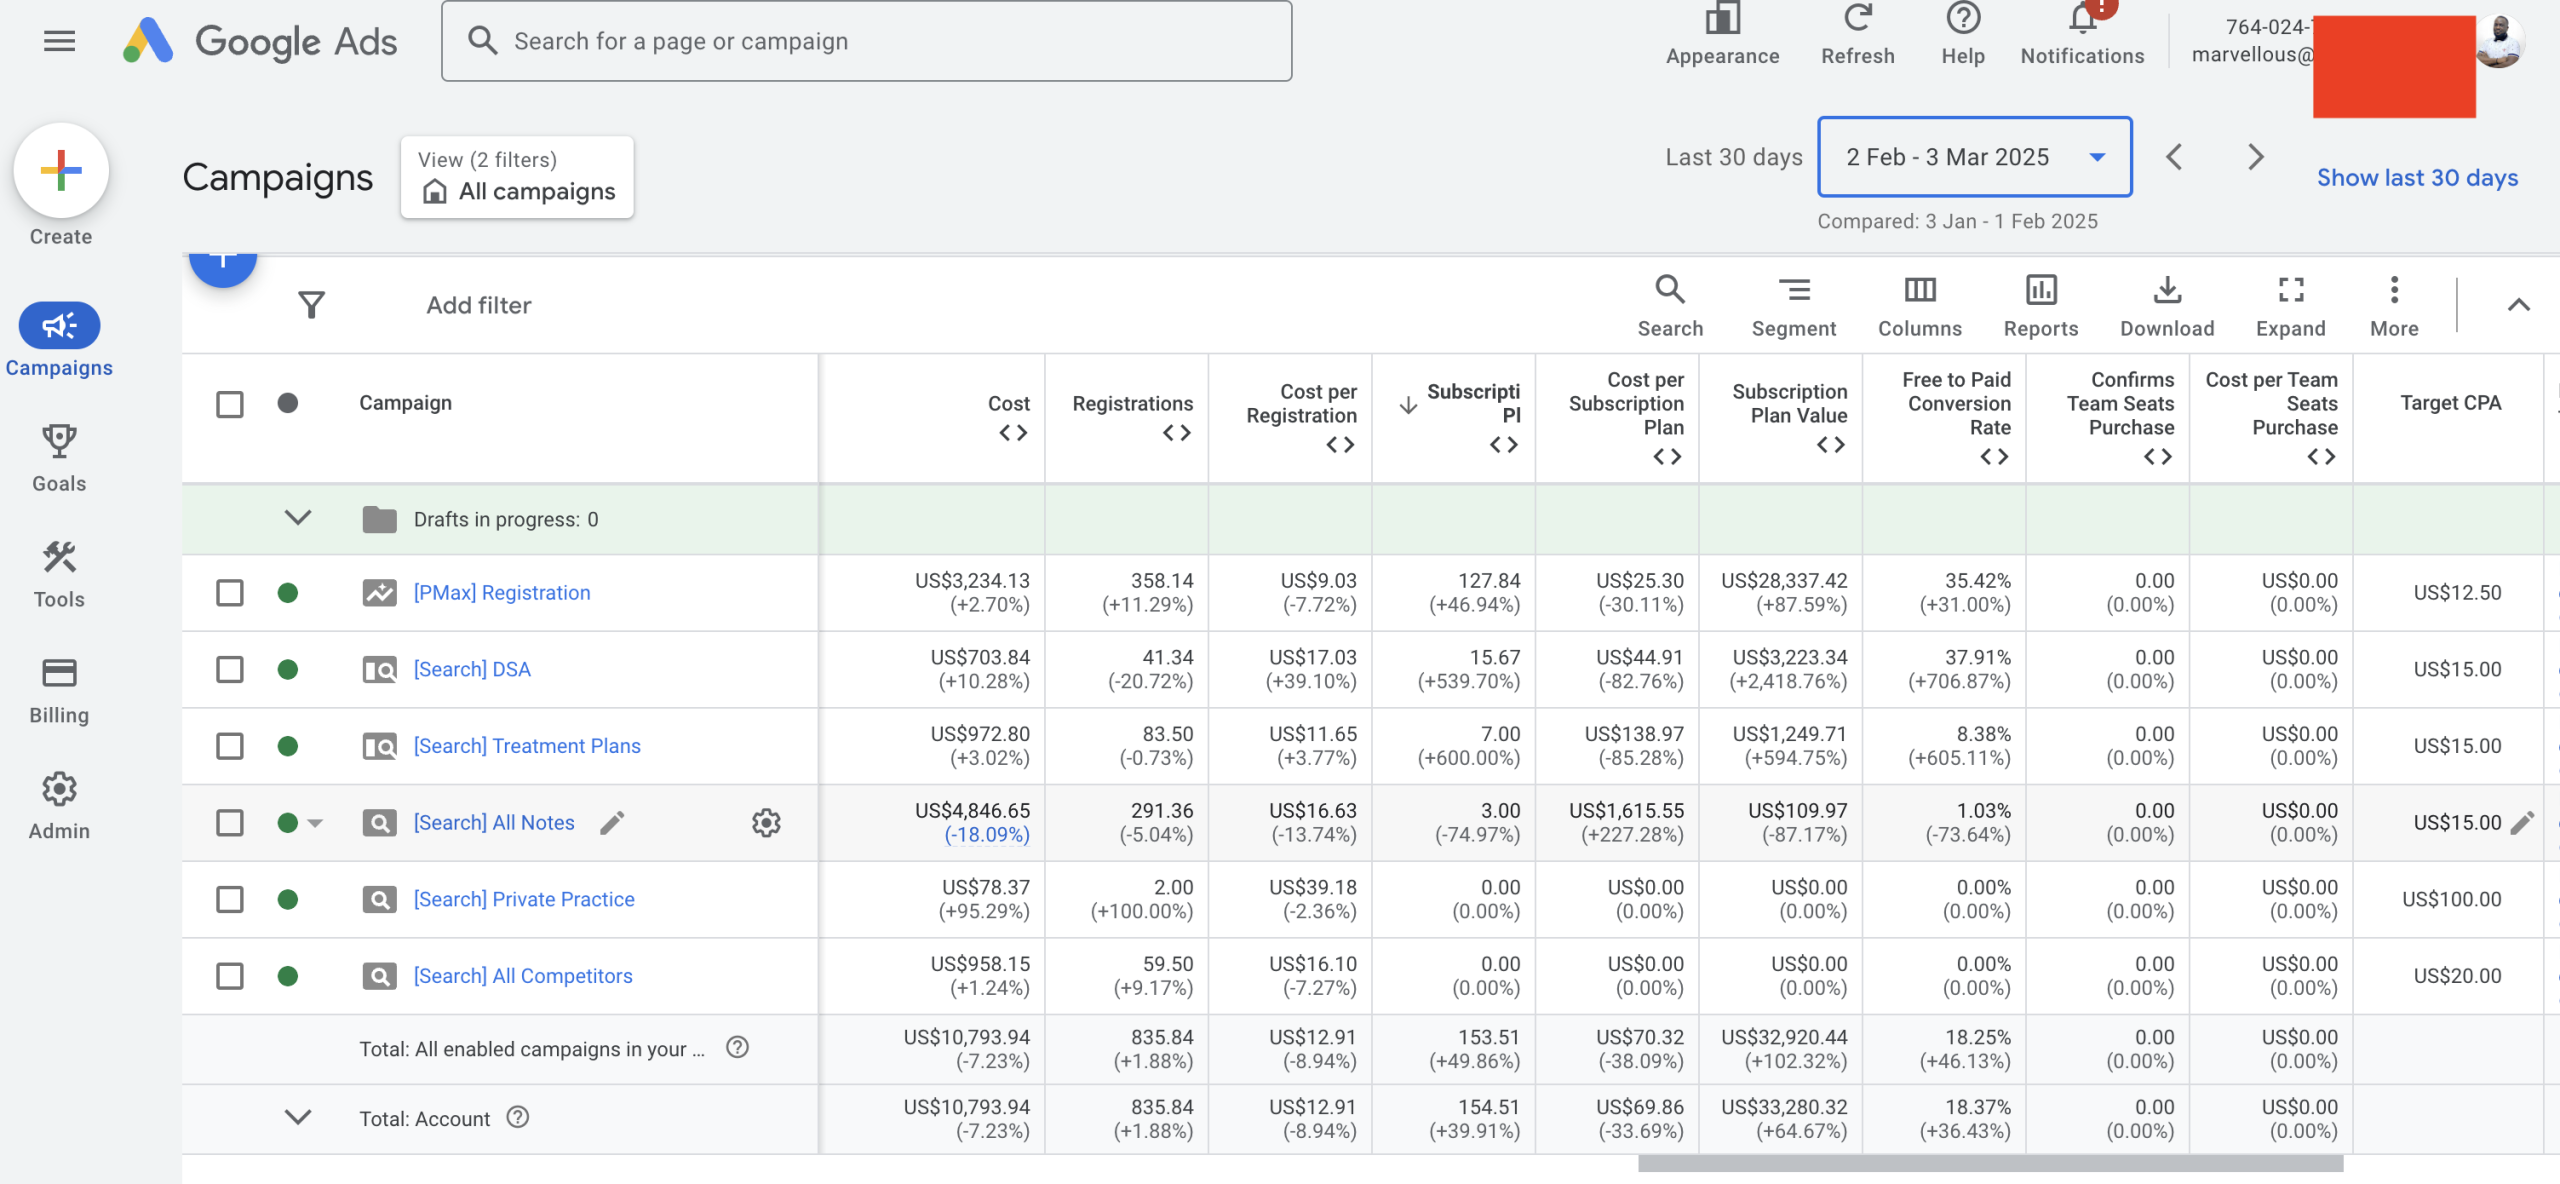
| Cost per Subscription | $255.01 | $69.86 | −72.6% |
| Subscriptions Generated | 18 | 155 | +742% |
| Subscription Plan Value | $3,620.43 | $33,280.32 | +819% |
| Registrations | 169 | 836 | +394% |
| Free to Paid Conversion % | 10.25% | 18.37% | +79% |
| Total Ad Spend | $4,677.65 | $10,793.94 | +131% |
| ROAS (Account Level) | 0.77x | 3.08x | +300%+ |
What we learned
- Cost per subscription dropped from $255 to $69.86
- ROAS increased from 0.77x to 3.08x
- Subscriptions scaled 8X in under 90 days
- MRR grew from $3.6k to $33k+
- Conversion funnel fully optimised and segmented
Performance screenshots